Verizon Connect, 2025
Designing an AI feature to help analyse logistics operations
I led end-to-end design for an AI insights feature that launched to 30K fleet managers across North America. I helped keep the team aligned on requirements, validated concepts through user research, and delivered a solution that achieved ~14% user activation in the first week.
Team: 1 Design Lead, 1 Product Owner, 4 Engineers, 2 Data Scientists.
Project summary
Challenge
Make fleet data easy to understand for all users, helping them take action faster while Verizon Connect captures market share in the AI-powered fleet sector.
Solution
An AI agent that monitors fleet data, automatically detects anomalies, analyses trends, and generates text-based insights, saving fleet managers 45 min/week by surfacing what matters most.
Impact
93% approval rate
Among 300 beta users who tested the solution for 6 months, 93% considered the tool essential for their work.
~14% week-1 activation
In the first week after launching to 30K users in US, 14% activated the feature and returned at least twice.
Reducing the user effort tax
Accessing fleet data in Reveal was extremely manual. Users had to manually navigate multiple reports, download CSVs, and build custom spreadsheets, creating friction that hurt retention when the output didn't match expectations.
The new mental model
Using AI, we challenged the legacy product flow and proposed a new mental model where the system responds to user needs, reducing time-to-value and effort to extract insights.
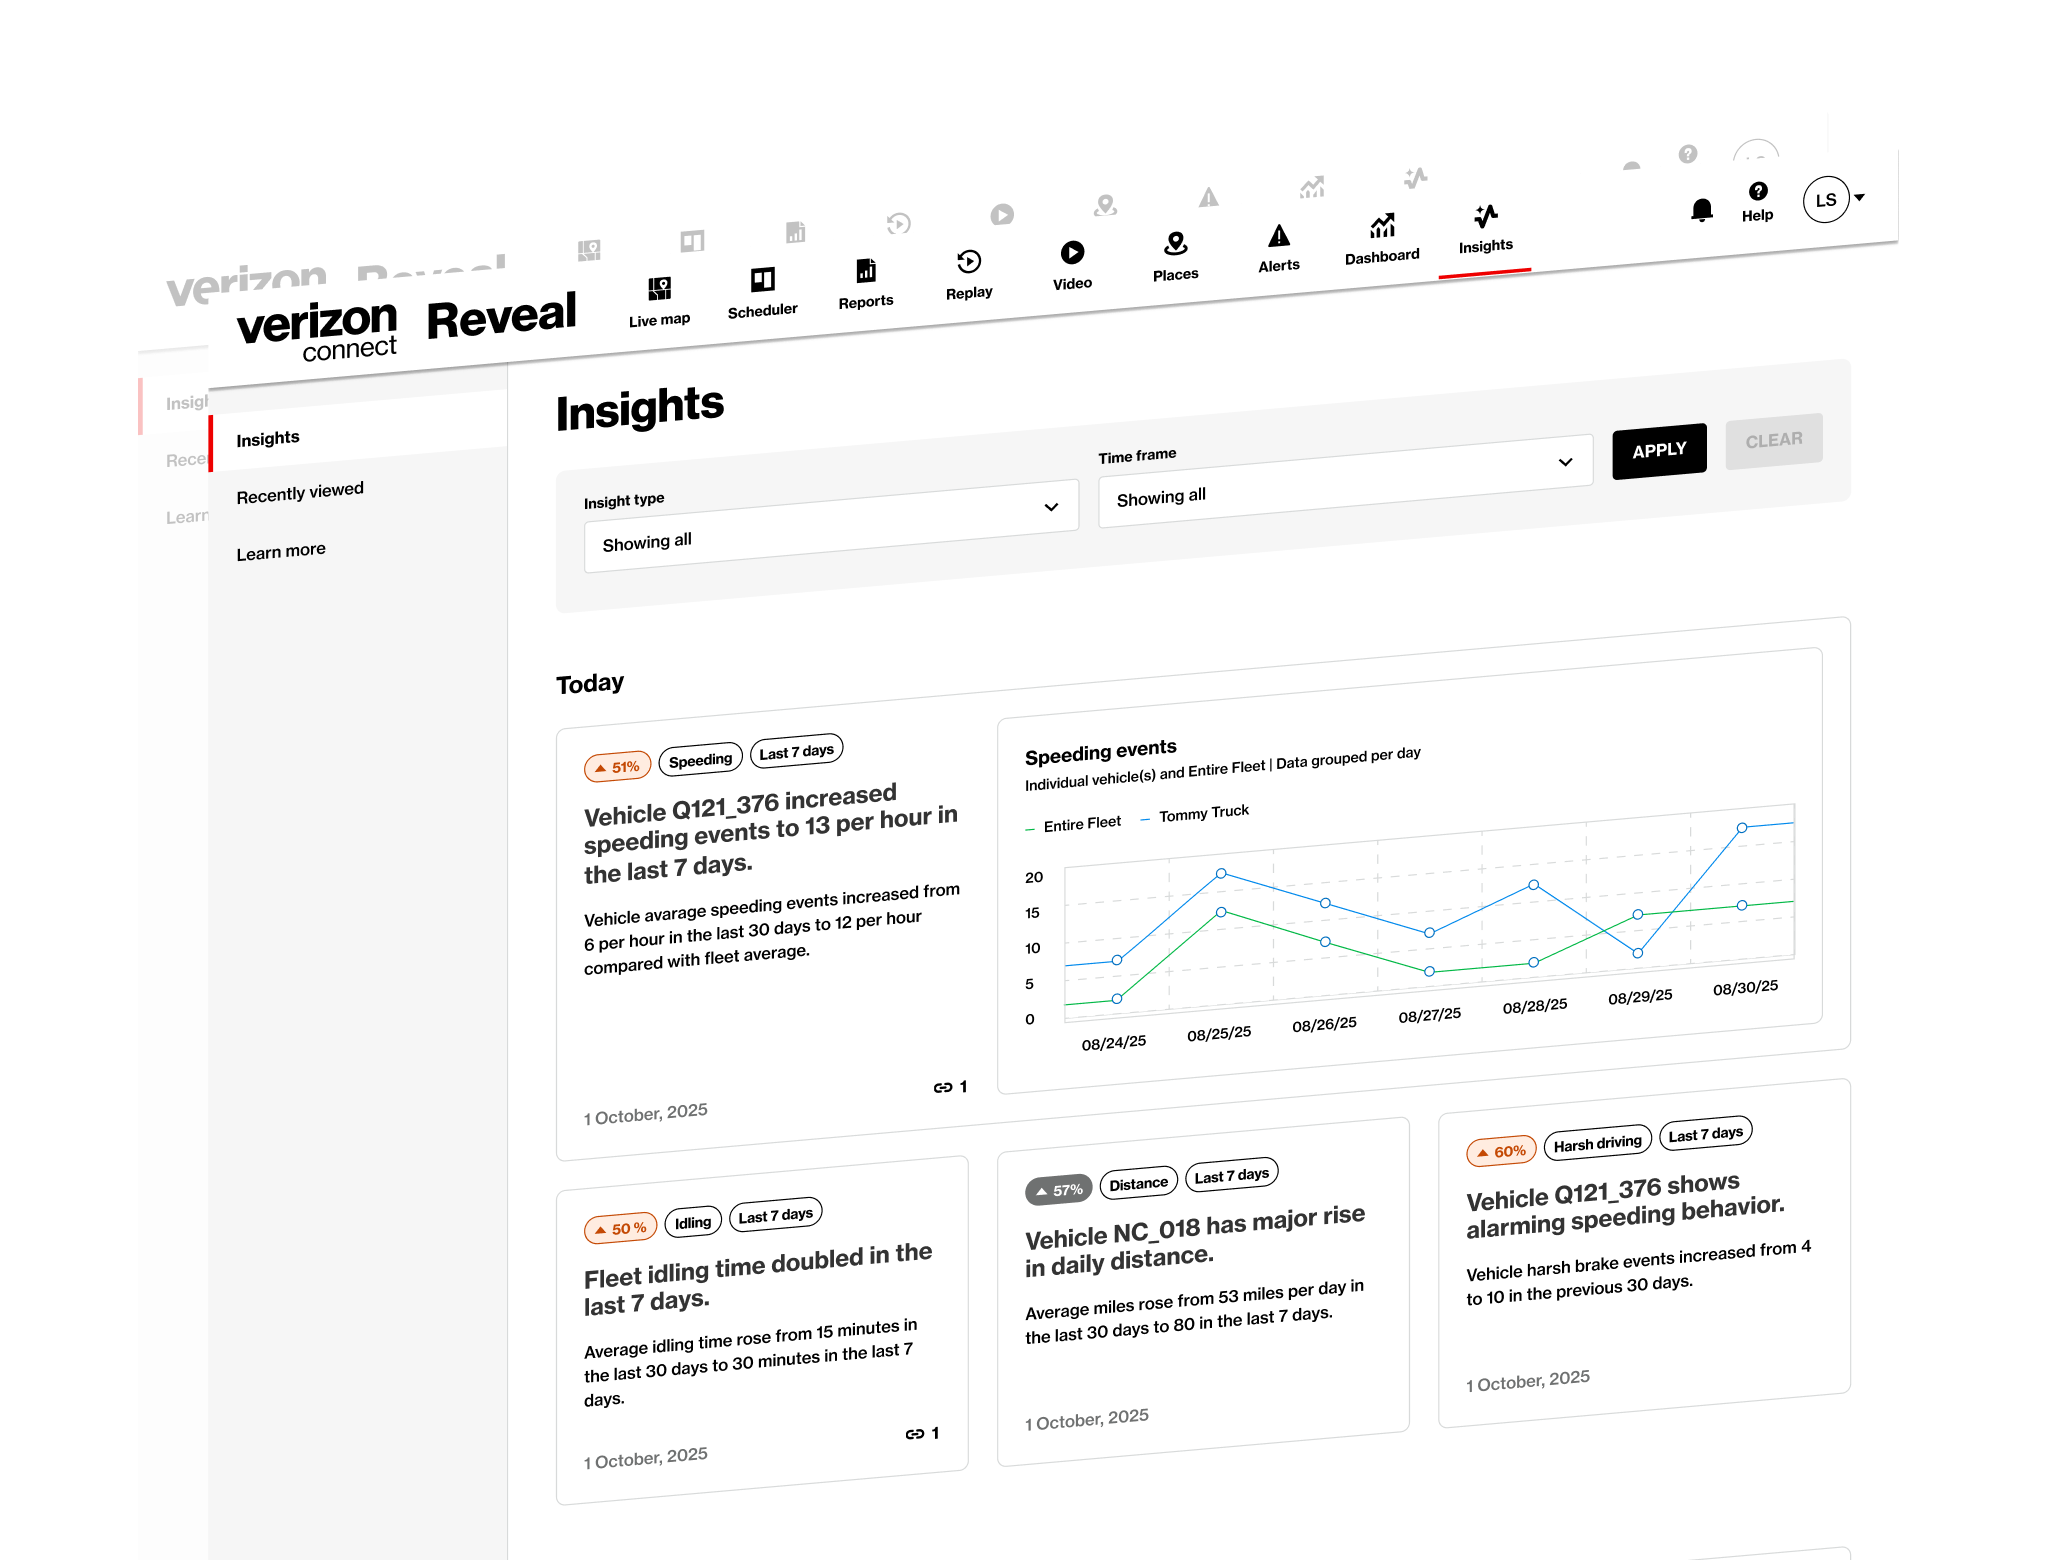
The solution
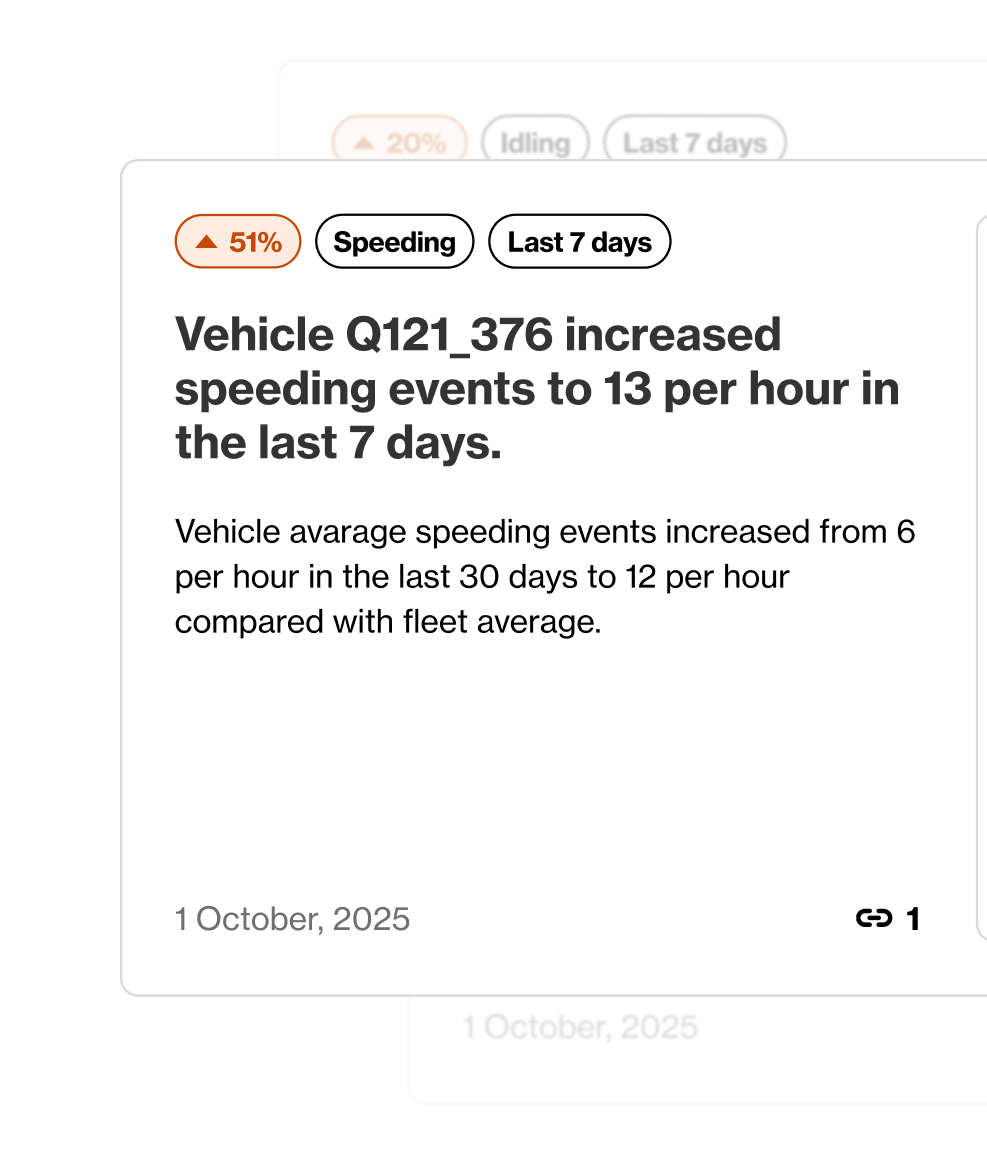
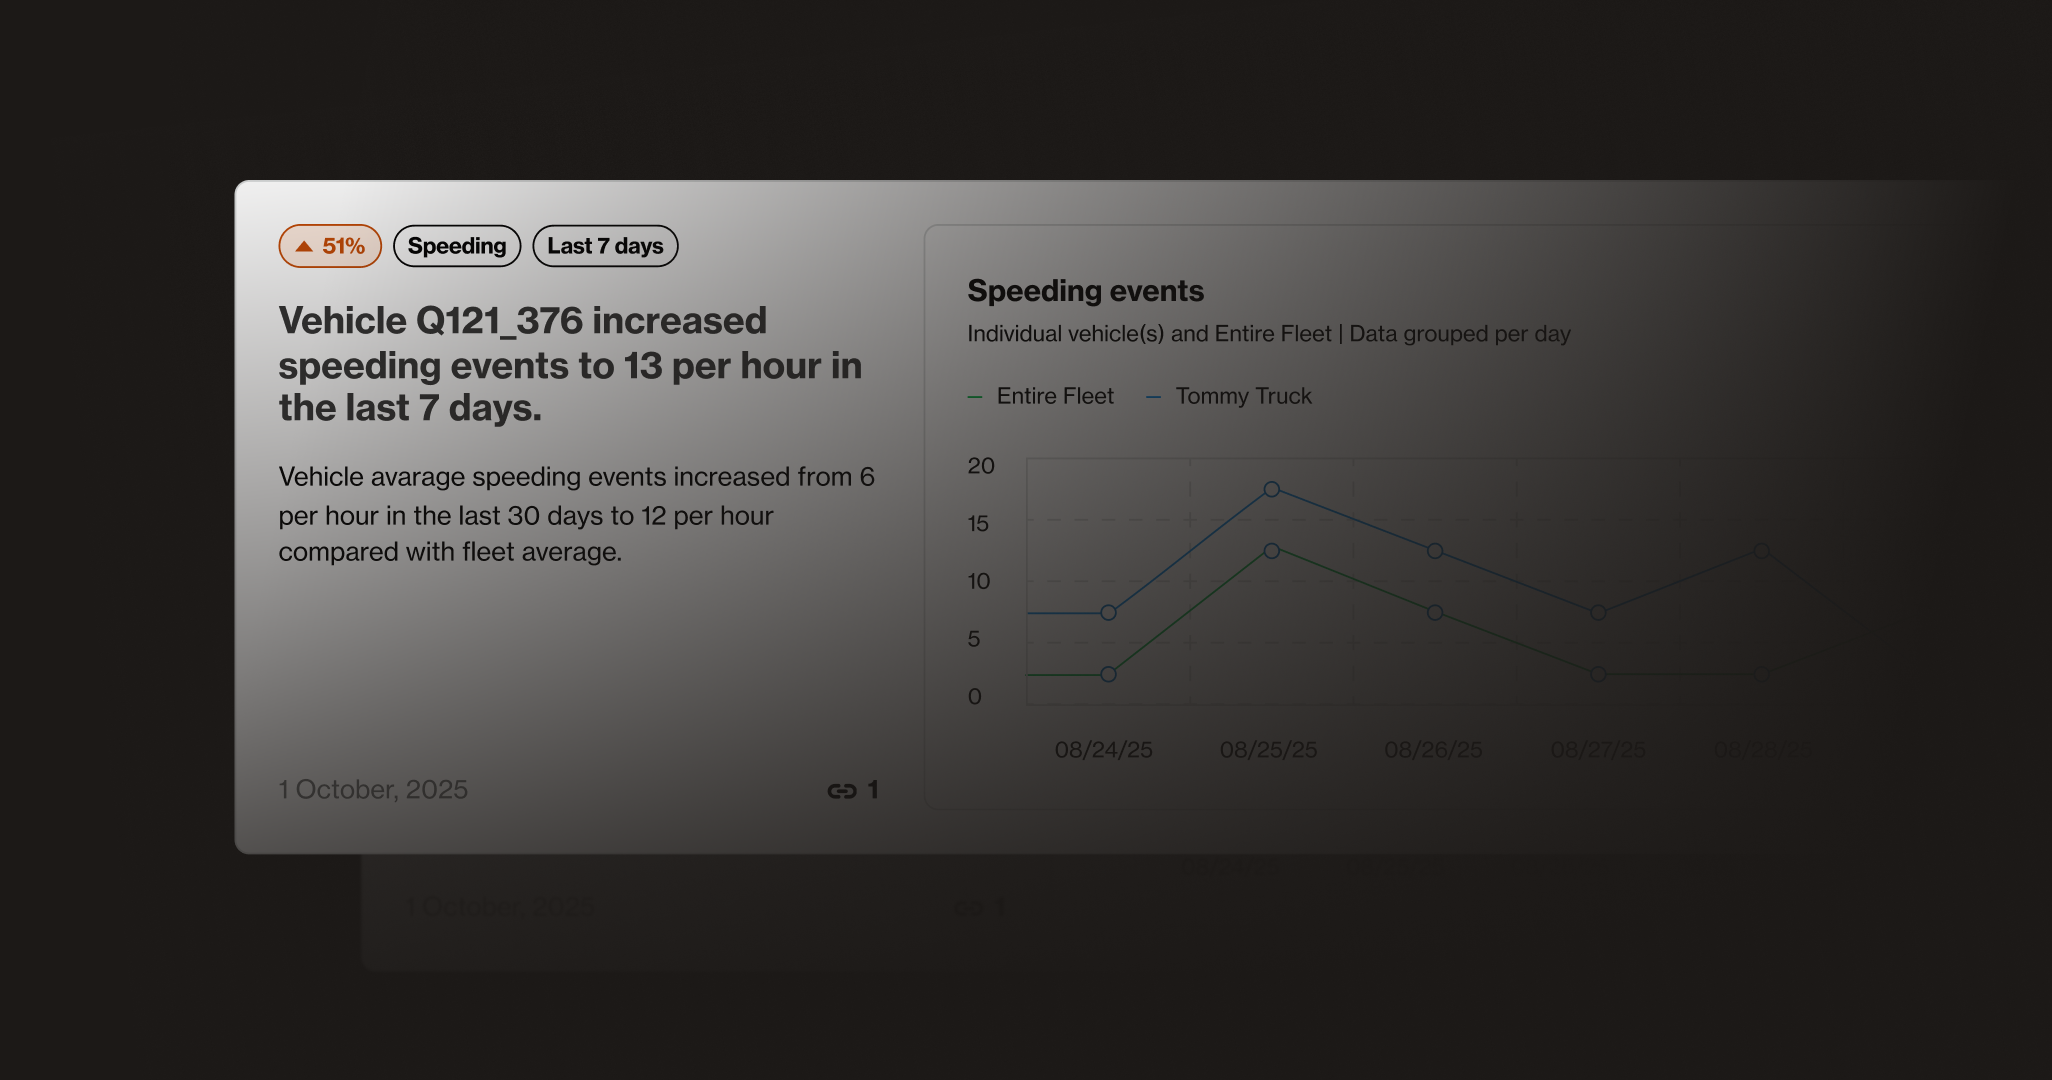
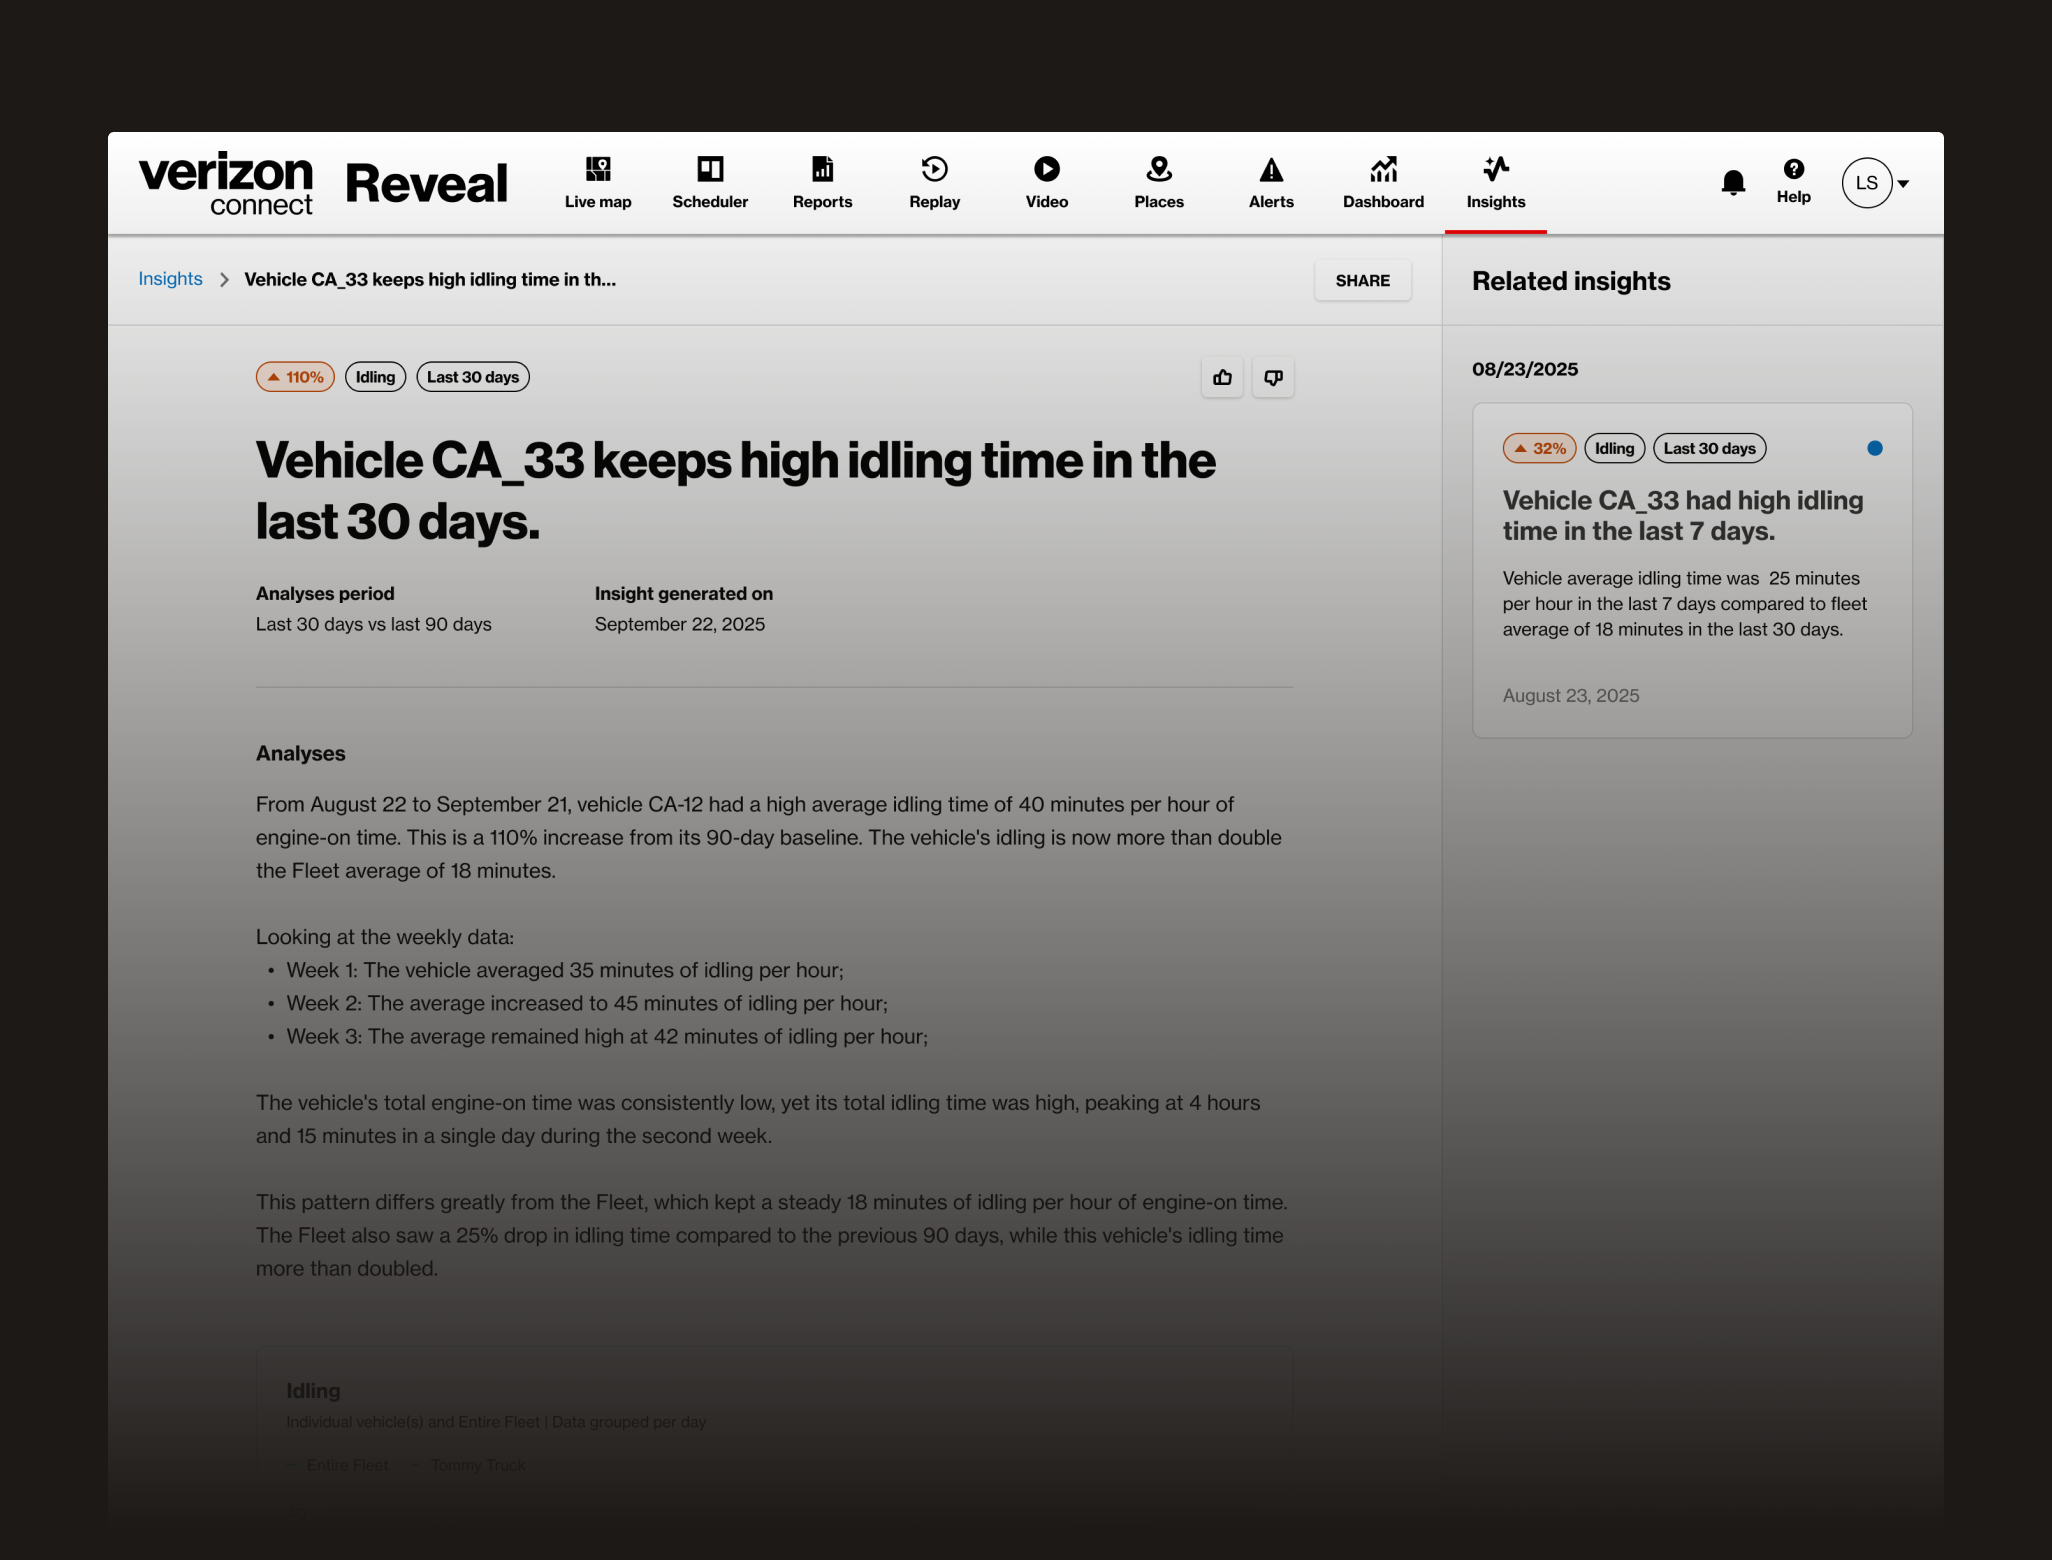
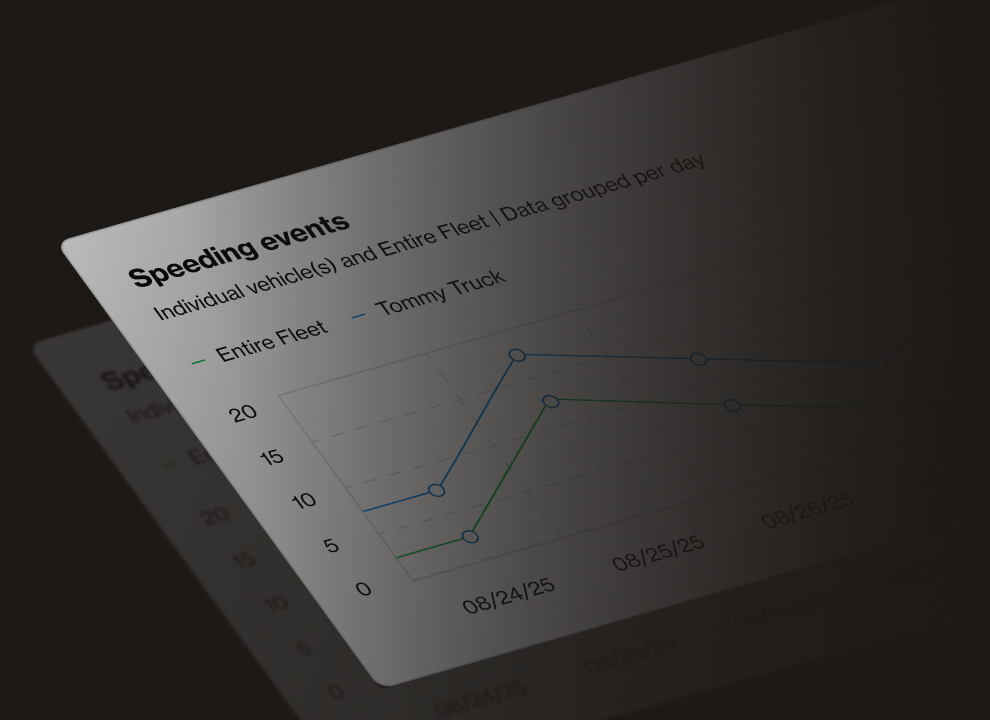
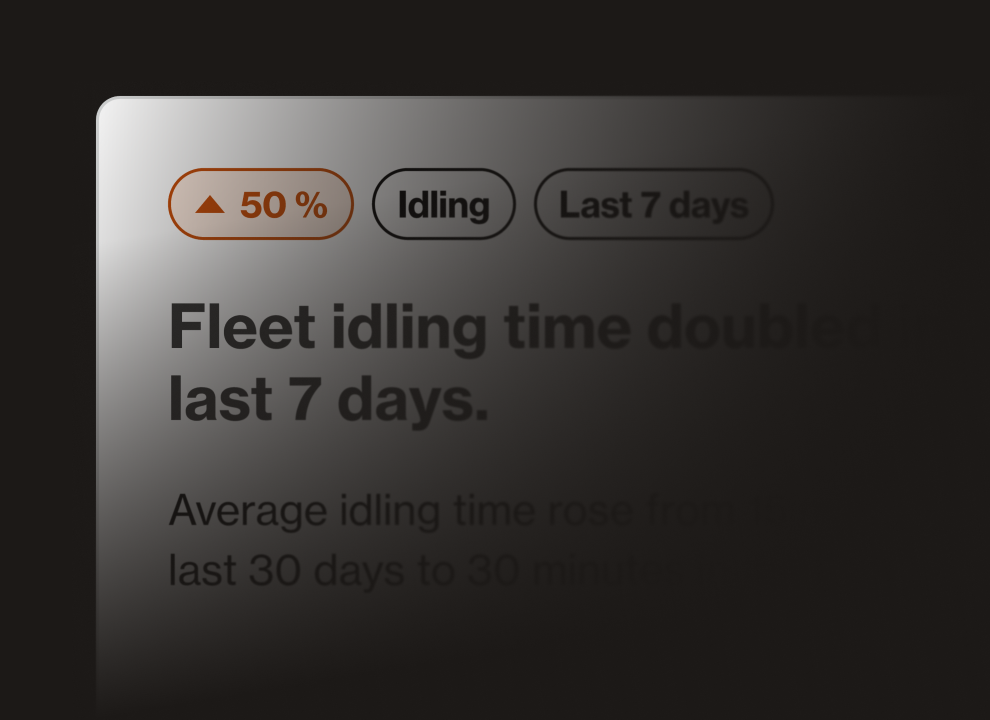
An AI agent monitors vehicle data over 7-day and 30-day periods, comparing each vehicle against the fleet average and its own past performance. When it spots meaningful patterns, it generates insights explaining what's happening and why it matters.
We designed a dashboard where users can immediately access core information: operational area, increasing or decreasing values, and a summarised description of AI-generated insights.
Outcomes
93% approval rate
Among 300 beta users who tested the solution for 6 months, 93% considered the tool essential for their work.
~14% week-1 activation
In the first week after launching to 30K users in US, 14% activated the feature and returned at least twice.
The things that you find I would never have seen probably 90% of the time, which was surprising. We haven't been tracking how many times the truck stops or how long they idle.
– Beta user feedback
Insights save me at least 45 minutes per week by eliminating the need to run and manipulate reports. It's also valuable for sharing information with our operational team much more efficiently.
– Beta user feedback