Builders and contractors learn construction techniques and products on this platform. Fewer of them were completing a course. I designed an In Progress section and short course descriptions, so students could pick up where they left off and choose the right course.
I was the only designer, from discovery to delivery, working with a product owner, a data analyst and two engineers.
What are the results of this work?
Certifications went up 8% in the first 30 days.
We ran an A/B test with about 200 students in each group. More students started a course and finished it, so more of them got certified.
Students finished a course 40% faster.
The median time from starting a course to finishing it fell from 30 hours to 18.
The situation
Many students gave up before they reached a certificate
Product data showed completion and certifications dropping, and the business tracked both to see if students stayed. Interviews with students showed two reasons.
Returning students couldn’t find their courses.
The list treated every course the same, so they scrolled the whole catalogue.
New students couldn’t tell what a course taught.
They had to watch a few videos to find out, so some picked the wrong one and left.
Experiment 01
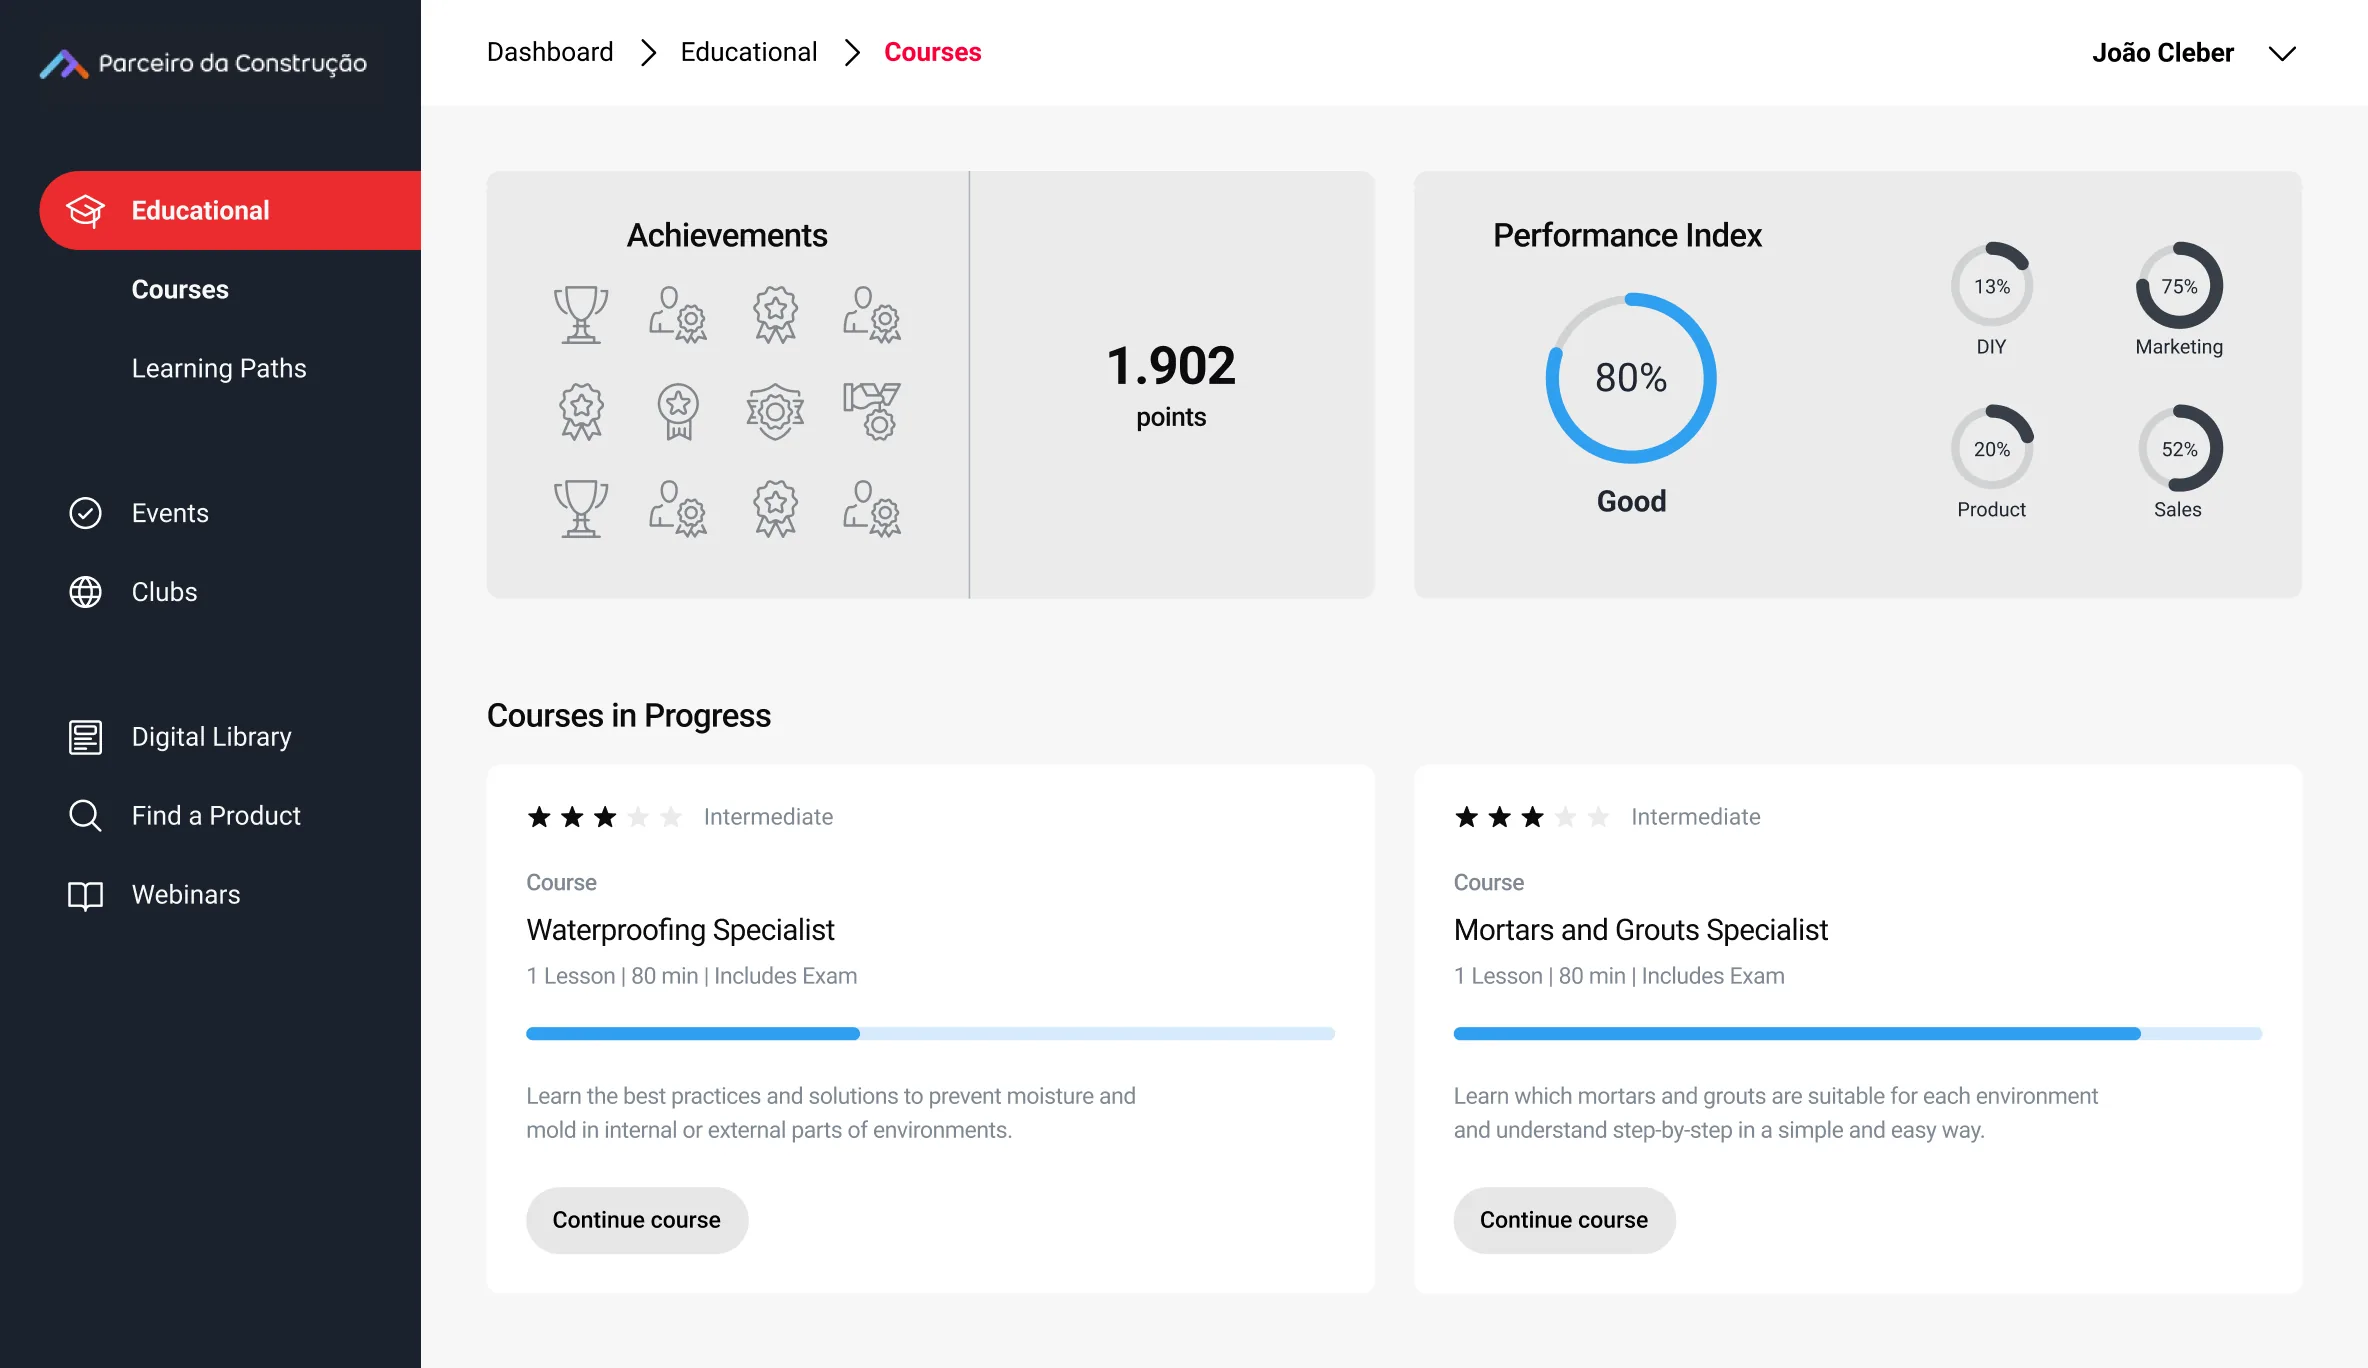
I put every course a student had started in one In Progress section.
When students came back, they had to find their course again before they could continue. I designed an In Progress section at the top that held every course they had started. My bet was simple. If getting back in took no searching, more students would keep going.
It worked. Students who had the section finished their courses 40% faster.
Experiment 02
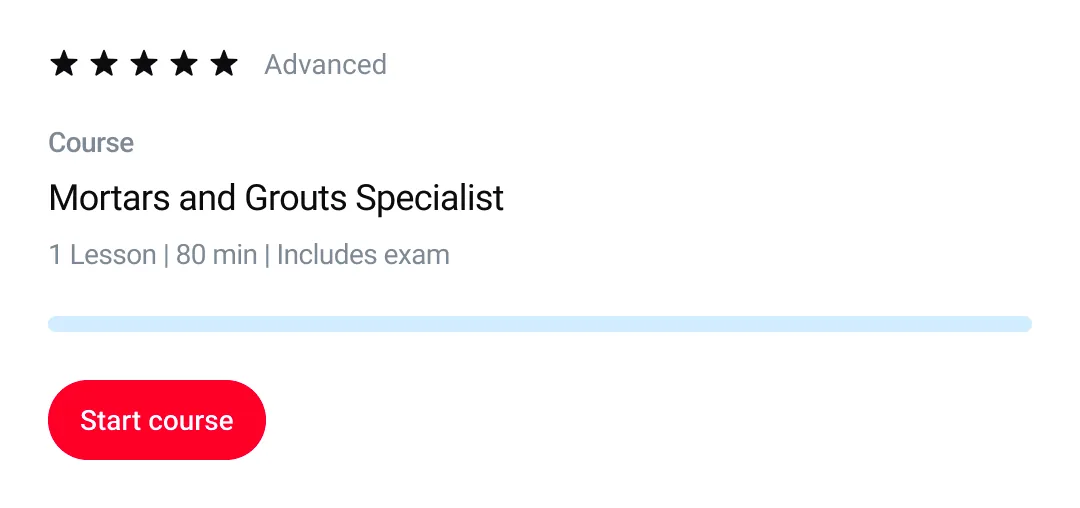
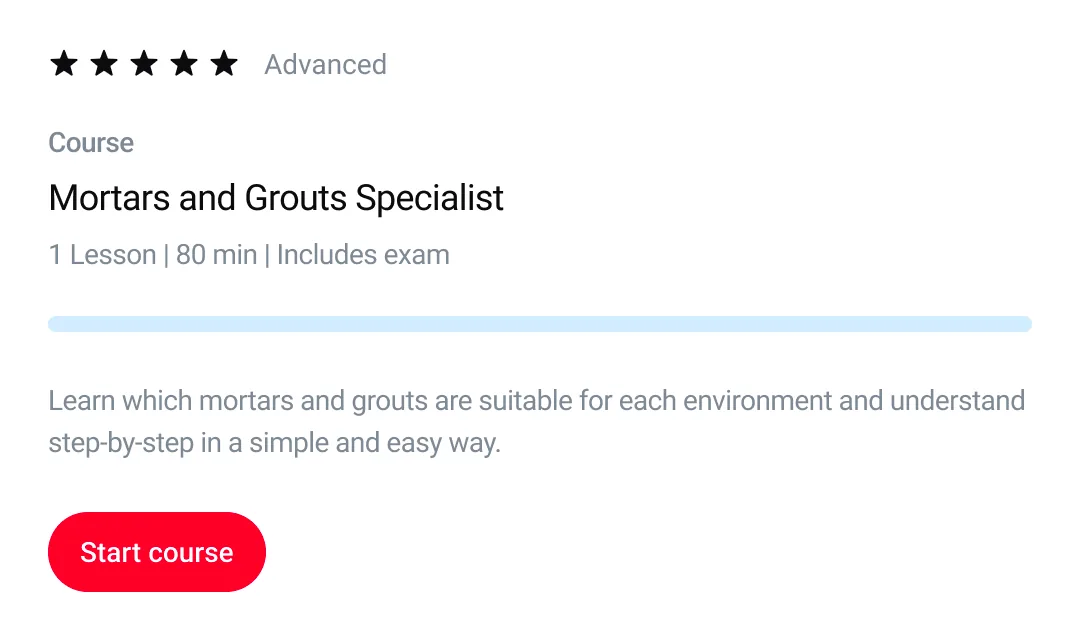
I added a short description to every course card.
New students had no way to know what a course covered without opening it and watching. So each course card got a few lines saying what it teaches. Students could choose before enrolling, instead of guessing.
That’s where the 8% came from. More students started a course, finished it and got certified.
The outcome
Students found their way back to their courses, and picked better ones to start.
The two changes were small, and both showed up in the numbers. I started the learning platform redesign right after these experiments and ran both projects side by side, so what we learned here went straight into it.
Certifications went up 8% in the first 30 days.
We ran an A/B test with about 200 students in each group. More students started a course and finished it, so more of them got certified.
Students finished a course 40% faster.
The median time from starting a course to finishing it fell from 30 hours to 18.